How we built observability with Google Cloud services

A common approach to addressing a production issue is to try to reproduce it in a non-production environment. Once reproduced, the fix can be coded and tested in the non-production environment before applying to production.
While this approach worked well for most of our issues, it left two vital gaps:
- There were always some issues (functional bugs, slowness, crashes) that we could not reproduce and thus not fix.
- When seeing an issue in production, we could not decipher how wide-spread a given issue was without an in-depth analysis (e.g. - happening for a single user or many users, happening for a moment, or throughout the day).
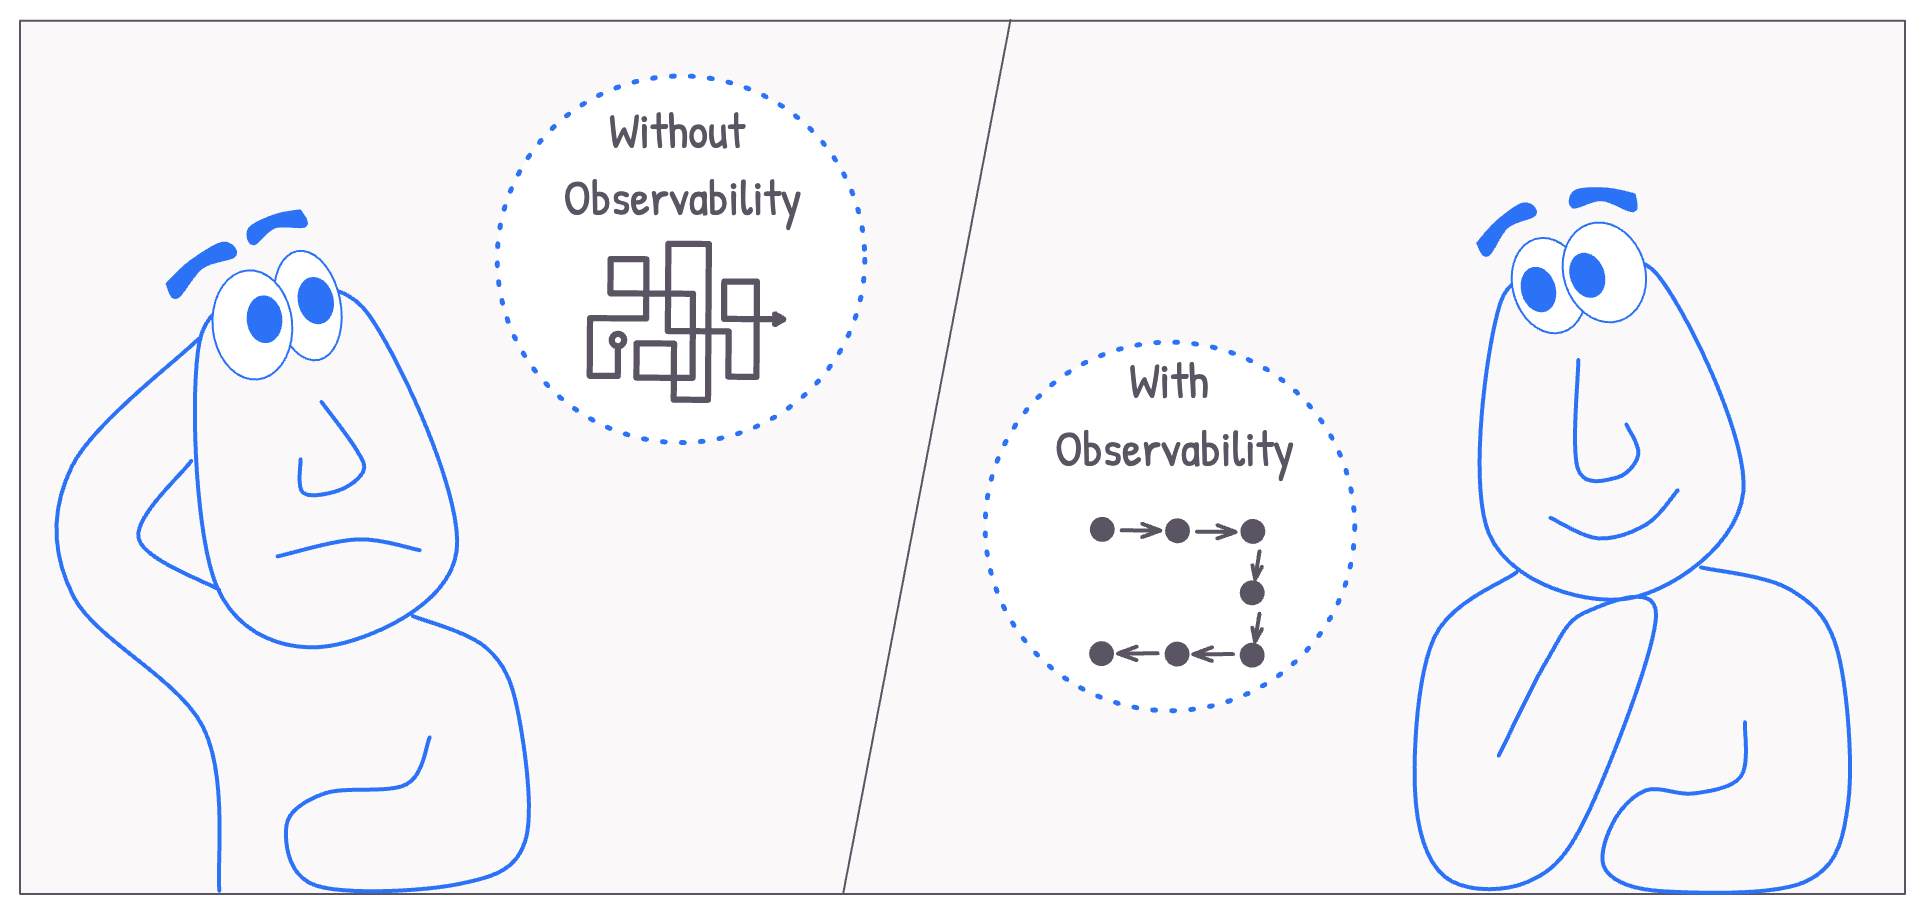
To address these two gaps, we decided to build better observability into our production setup.
Observability tools & why we picked Google Cloud Offerings
The observability market has various products that could cater to our requirement:
- Paid product suites like Datadog, NewRelic, and Dynatrace are feature-rich and easier to integrate but were out of our contention due to budgetary constraints.
- Grafana + Prometheus + Loki and Kibana APM (ELK stack) are free, but their integration involved a substantial effort (especially with respect to some legacy components of our setup).
Since our production setup already ran on Google Cloud, we evaluated if we could leverage Google Cloud’s tracing, logging & monitoring features to build observability. And, it turned out that from an effort & pricing vs benefit perspective, it worked out the best among the options for us.
A downside to choosing Google Cloud was that it would make us more cloud provider dependent. But, since we were not planning to migrate out of Google Cloud for multiple years, we decided to live with this limitation.
Our existing Google Cloud logging and monitoring setup
Our production setup running on Google Cloud consisted of various instance groups with autoscaling rules. A Google Cloud application load balancer received each of our requests and routed them to one of these instance groups. The requests coming to and responses sent by this load balancer were already being monitored via Google Log Explorer and Metrics Explorer.
- The Logs Explorer contained the log entries with details like request URL, response code, backend latency, etc. for each request served via the load balancer.
- The Metrics Explorer was used to monitor requests and responses (# of requests grouped by response code, backend latency, etc.) as well as instance group resources (CPU, memory, network, etc.).
The missing piece: Traceability
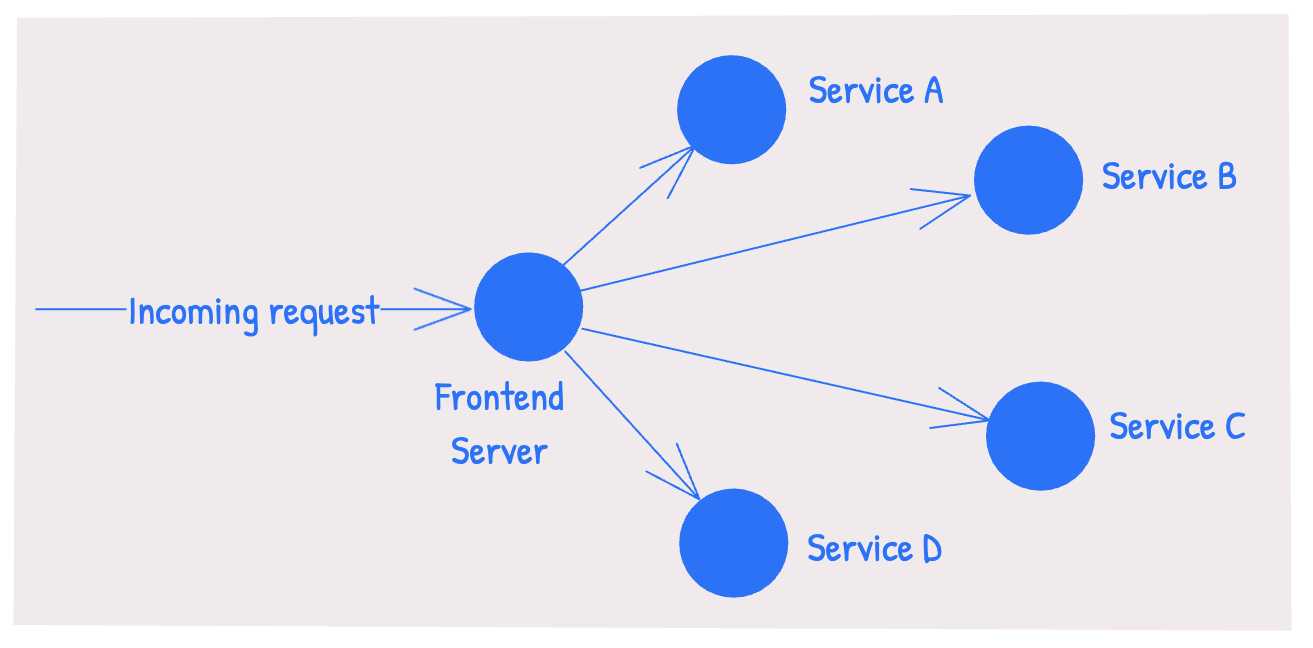
Once a request from a user’s device reaches our setup (let’s say, to serve a web page for https://www.mysite.com/products), multiple requests to different sub-systems within our setup are made to formulate the response.

While our logging and metrics system reported each of these requests (the one coming from the user’s device and the ones made within our setup to formulate the response), there was no way to tie these related requests together. So, in a production setup with thousands of requests every minute, if a request for https://www.mysite.com/products errored, there was no way to determine which of the sub-systems caused the error.
If we could link the first incoming request for https://www.mysite.com/products to all the consecutive sub-system requests made to formulate the response, we could easily identify which sub-system caused an unexpected behavior.
Setting up traceability would solve this for us.
Our Traceability implementation
Leveraging the OpenTelemetry integration
If we could set up Google Cloud Ops Agent on our instances, we could then use OpenTelemetry (an open standard) to emit traceability information. So, we configured our instances to have the Ops Agent running.
We found that OpenTelemetry libraries exist for a very large number of languages (Node, PHP, others), frameworks (Symfony, Express, others) and logging libraries (PSR-3, Winston, others). We integrated these OpenTelemetry libraries within the various services depending on the existing language, framework and logging in use.
Setting up sampling to keep traceability overhead and costs in check
We wanted to ensure that our traceability setup wouldn’t add notable performance overhead or cause cost overruns. So, we configured our trace libraries to sample a small percent of requests:
import { TraceIdRatioBasedSampler } from '@opentelemetry/sdk-trace-node';

const samplePerc = 0.1;

const sdk = new NodeSDK({
  //...
  //...
  sampler: new TraceIdRatioBasedSampler(samplePerc),
});
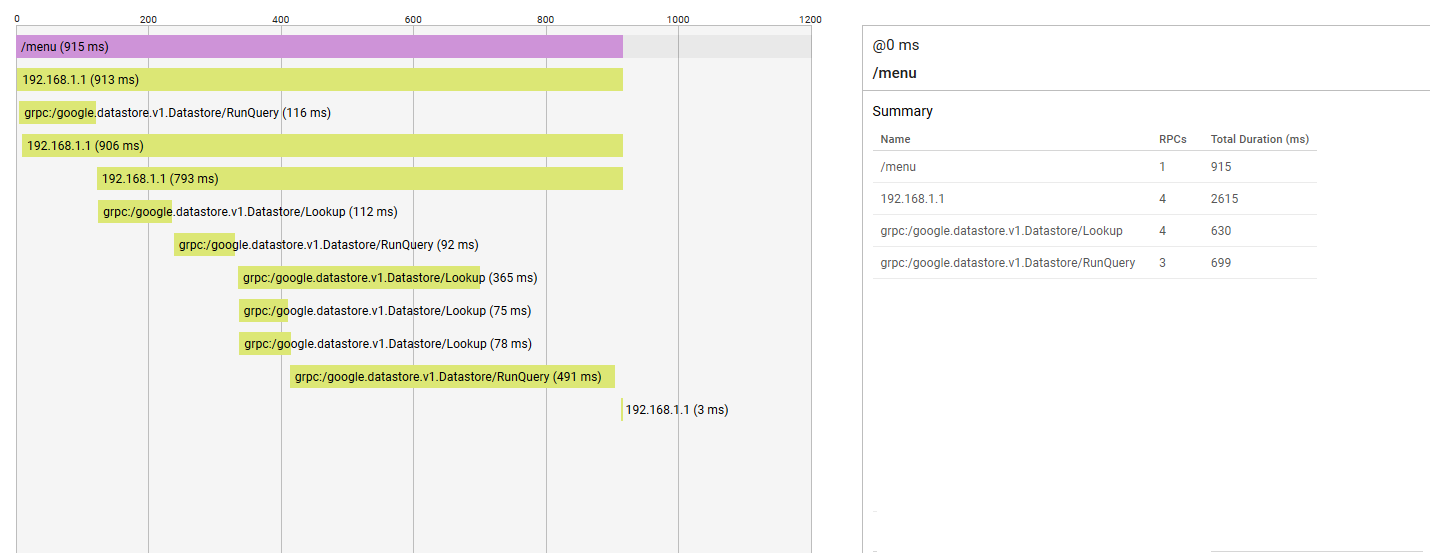
With the OpenTelemetry libraries integration and Google Cloud Ops agents setup, we could view the trace information within Google Cloud Trace Explorer for the sampled requests.

Traceability for the requests not picked in the trace sampling
A small percent of our requests were traced via Google Cloud Trace Explorer. However, all the requests reaching our load balancer were already logged and viewable via Google Log Explorer. For these requests not picked in the trace sampling, we still wanted to achieve the following:
- We wanted to see all the related requests within Google Log Explorer in a single view. And we wanted to be able to do this for 100% of our requests.
- Every time a request resulted in an error, we wanted to log the custom error message from our code to Google Log Explorer. We also wanted this custom error message log entry to be tied to the related requests.
To achieve the above, we needed to ensure traceability for requests excluded by the trace sampling. We achieved this by implementing the following -
If one of our services makes a request to another service within our setup, it should pass the incoming request’s trace-id to such downstream requests.
const traceId = req.headers['x-cloud-trace-context'];
axios.defaults.headers.common['x-cloud-trace-context'] = traceId;
With the above, 100% of our requests in Google Log Explorer could be traced at no additional cost or performance overhead.
And, to tie the custom error messages from our code to this traceability information, we added the incoming request’s trace-id to the log messages.
//logging to the Google log explorer with @google-cloud/logging-winston
GCPWinstonLogger.error('', {
  statusDetails: err?.status || -1,
  message: err?.message || 'Error',
  url: `${req.hostname}${req.originalUrl}`,
  [LoggingWinston.LOGGING_TRACE_KEY]: traceId,
});
With the above, the custom error message in one service could be linked to a custom error message in another service. And all of this could be viewed via Google Log Explorer.
How we use our Observability setup
With the above detailed implementation, our Observability requirements are adequately covered as following:
- We leverage Google Cloud Trace to understand the following:
- When a certain kind of requests (example, -
/searchrequests) are slow, the cause of the slowness. - We can gradually add custom spans to further drill down these common causes of slowness (certain query, certain part of code, etc.).
- When a certain kind of requests (example, -
- We leverage Google Log Explorer to understand the following:
- When a specific request errors / is slow - what caused the issue for that specific request.
- We leverage Google Metric Explorer to quantify the extent of a custom error behavior:
- The count of log entries with a certain error in comparison to the count of entries with HTTP 500 tells us what percentage of HTTP 500 are caused by a certain error condition.
- We track these via dashboards to allow us to quickly identify the extent of an erroneous / slowness behavior.
Conclusion
With the above detailed observability setup in place, we could achieve the following:
- We could quickly identify costly components of slow-performing requests with Google Trace Explorer.
- With traceability integrated into the log entries visible in Google Log Explorer, we could debug / analyze any issue that occurred in production.
- With gradually built custom dashboards containing various metric charts, we could keep a tab on the health of our overall system at a glance.
- With OpenTelemetry libraries, we limited our cloud provider dependency.
- The above setup could be achieved with limited performance and cost overhead.

Got a web-dev pain point?
I'm an independent web dev & architect.
What I do:
- Architecture - Guidance on frameworks, tools, system design, cloud infra
- Fullstack Dev - Frontend, backend, CMS customization, migration, upgrade
- Optimization - Core web vitals, scalability, SEO compliance
Tech I use:
Node.js, React, Next.js, Postgres, Strapi, Directus, MySQL, AWS, GCP, Serverless (Lambda, CF Workers), ElasticSearch, Redis, RabbitMQ, Kibana
My Clients Include:


Or email: punit@tezify.com

I'm an independent web dev & architect.
What I do:
- Architecture - Guidance on frameworks, tools, system design, cloud infra
- Fullstack Dev - Frontend, backend, CMS customization, migration, upgrade
- Optimization - Core web vitals, scalability, SEO compliance
Tech I use:
Node.js, React, Next.js, Postgres, Strapi, Directus, MySQL, AWS, GCP, Serverless (Lambda, CF Workers), ElasticSearch, Redis, RabbitMQ, Kibana
My Clients include:


Or email : punit@tezify.com
 Hire Me