How we made Sentry work to swiftly identify production issues

Back in April 2022, one of my clients identified the need to check if our website code had issues in production that were not known to our team. To gain a measure of this, we set up Sentry within our Frontend code. We were surprised to learn that our visitors were experiencing 100+ exceptions every hour. Close to 5% of the visits to our website were experiencing an exception of some kind. Ouch!
This number was large enough to warrant immediate attention. But, the barrage of data also made it challenging for us to correctly prioritize fixing these issues. Naturally, we wanted to fix those issues first where the fix was low on effort but high on business impact. But, doing so effectively required us to fine-tune our Sentry configuration so that the barrage of data could be organized for us to make sense of it.
This post details how we gradually steered our Sentry configuration to adequately organize the issues it reported. And, how this helped us with effectively addressing the issues.
Customizing issues grouping with Sentry fingerprint
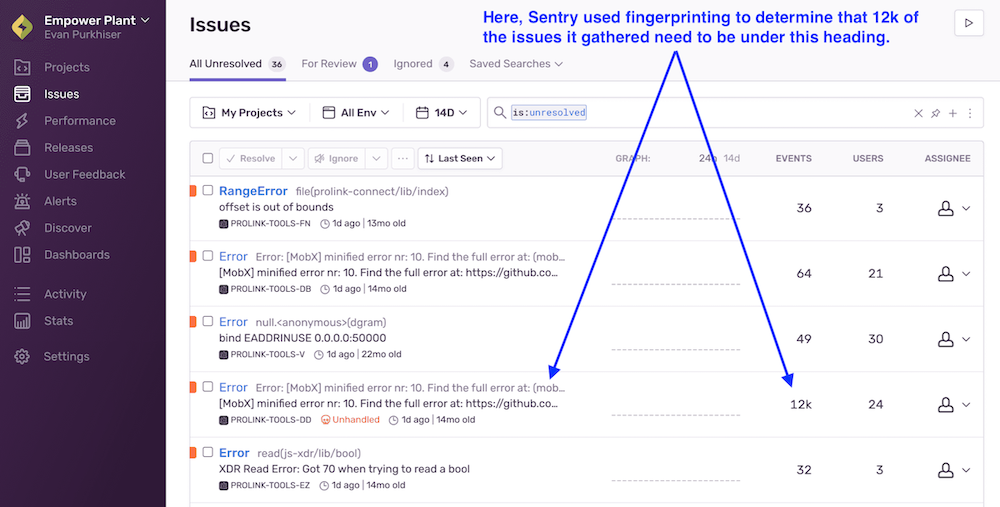
Sentry uses a mechanism called fingerprint to group the issues together. Sentry dashboard displays grouped issues under a single heading.

For our setup, a lot of similar issues were displayed under different headings, while a lot of distinct issues were often grouped under a single heading. As a result, we could not know if a certain issue was actually occurring 10 times or 1000 times. To fix this, we delved deeper into Sentry’s default fingerprint mechanism.
By default, Sentry uses stack trace to group events together. For our setup, when a certain exception was raised from two different locations in code - it wasn’t being grouped together. On the other hand, when the API responses of 400 and 500 were both resulting in the same frontend exception stack trace, they were being grouped together.
We overcame this behavior by overriding Sentry’s default fingerprinting logic. We set up custom error message IDs to be sent to Sentry within our catch blocks:
Sentry.captureMessage("API-SERVER-500 : API returned HTTP 500");
We then modified Sentry’s fingerprint logic to use these codes we were passing to group the messages on it’s UI.
Sentry.init({
  ...,
  beforeSend: function(event, hint) {
    const error = hint.originalException;
    if (error.message.includes('API-SERVER-500'))
      event.fingerprint = ["api-server-500"];
    else if (error.message.includes('API-SERVER-400'))
      event.fingerprint = ["api-server-400"]
    ...
    ...
    ...
    return event;
  }
});
With the above customization, Sentry dashboard UI was now grouping the messages based on the message codes that we were passing. This gave us complete control over Sentry’s grouping. With the correct grouping, we could better prioritize and analyze issues based on their occurrence counts and trends.
Capturing the trail of events with Sentry breadcrumbs
Sentry breadcrumbs allow us to record a trail of events that happened prior to an issue. This is important to reproduce an issue. In fact, Sentry records a few events as breadcrumbs without requiring any customizations.

Ours was a React + Redux website. So, we created a Redux middleware that would capture the dispatched actions as Sentry breadcrumbs:
Sentry.addBreadcrumb({
	category: 'redux-action',
	message: action.type,
	data: action.payload,
    level: "info",
});
With just the above breadcrumb configuration, we could now see a series of dispatched actions before an error occurred. This reduced the effort required to reproduce and fix the observed issues.
Categorizing issues with custom Sentry tags
Despite grouping our issues with custom fingerprints, our Sentry setup was still limited in the following ways:
- We couldn’t reproduce many of the issues because we did not know whether the issues were happening on
client-sideorserver-side. Or, ondesktopormobileversion of our code. - Also, issues like
API-SERVER-500(API returning HTTP 500 response) were being set at multiple places within our code. We wanted to get a route-specific (URL specific) breakdown of such API failures.
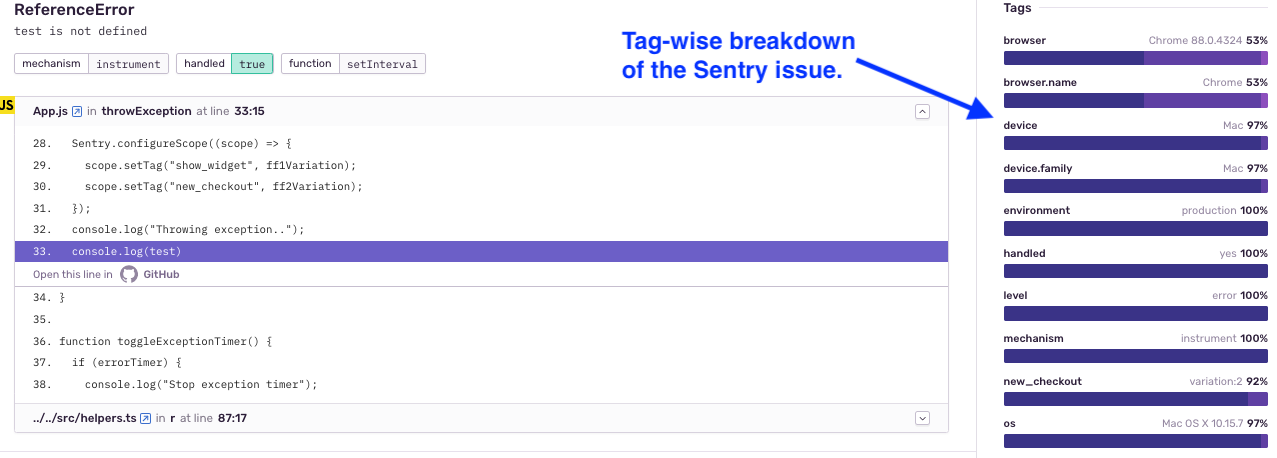
We leveraged Sentry tags to capture this additional information:
- Before sending the exception to Sentry, we passed platform specific information via Sentry tags:
Sentry.setTag("client_or_server", "ssr");
Sentry.setTag("mweb_or_desktop", "mweb");
Sentry.setTag("logged_in", false);
This helped us to reproduce environment-specific issues.
- To obtain a route-specific breakdown of our issues, we passed routes via tags:
Sentry.setTag("section",
window.location.
pathname.split("/")[1]);
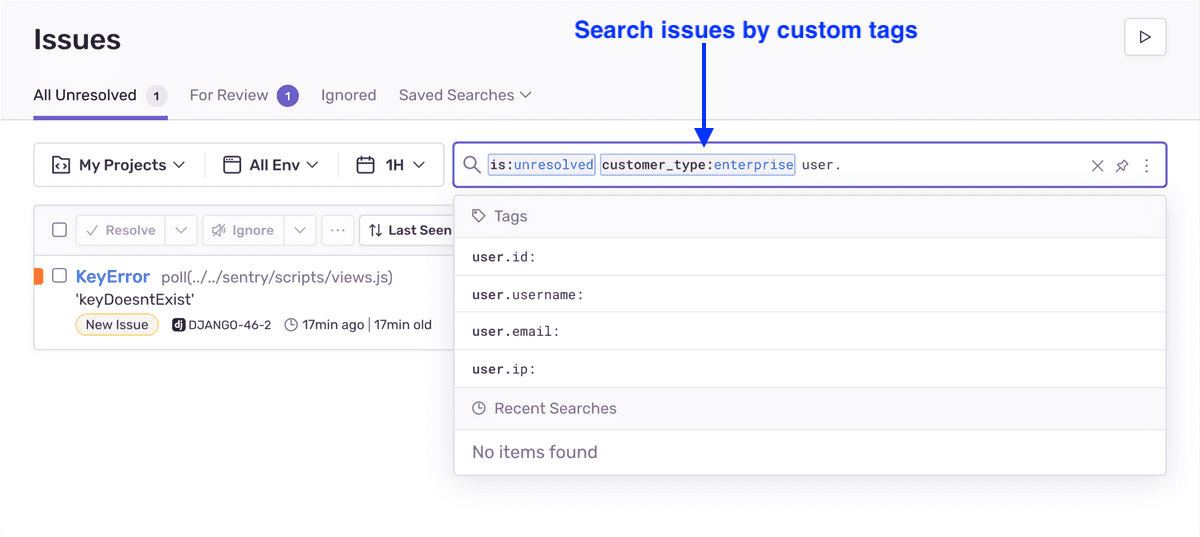
We were then able to get a route-wise breakdown of the issues. We could also filter or search issues by a certain tag value. This helped our prioritization (since some routes have a greater business impact than the others).


Passing API inputs & outputs with Sentry custom context
A lot of the issues our Sentry setup reported were API failures. These could be:
- The frontend passing invalid input values - a frontend code side issue.
- API erring even with valid inputs - an API (backend) side issue.
We needed to segregate the API failures into the two categories above. This was needed to identify where to fix the issue (frontend or backend). To achieve this, we captured the input and output for the failing API invocations. We leveraged Sentry context for the purpose:
Sentry.setContext("api-input-output", {
    args: sanitizeData(args),
    type: error?.method,
    error_code: error?.status_code,
    response_message: error?.text,
});
Reviewing the input and output for the failed API invocations helped us classify such issues into frontend and backend code issues. It also helped us assign the issues to the right stakeholder teams for quicker addressing.
Note: It is vital to anonymize this data to avoid leaking user-sensitive information to Sentry.
Passing git release information for future identification of issues
Near the end of our exercise, we had reduced the Sentry error-rate by 80%. At this point, we wanted to make sure to not leak new issues in the future.
To achieve this, we passed release information to Sentry. We used git-revision-webpack-plugin to gather git release information during the build (we were using webpack for our frontend build). We then passed this information to Sentry when initializing it:
Sentry.init({
  release: __FRONTEND_GIT_VER__,
});
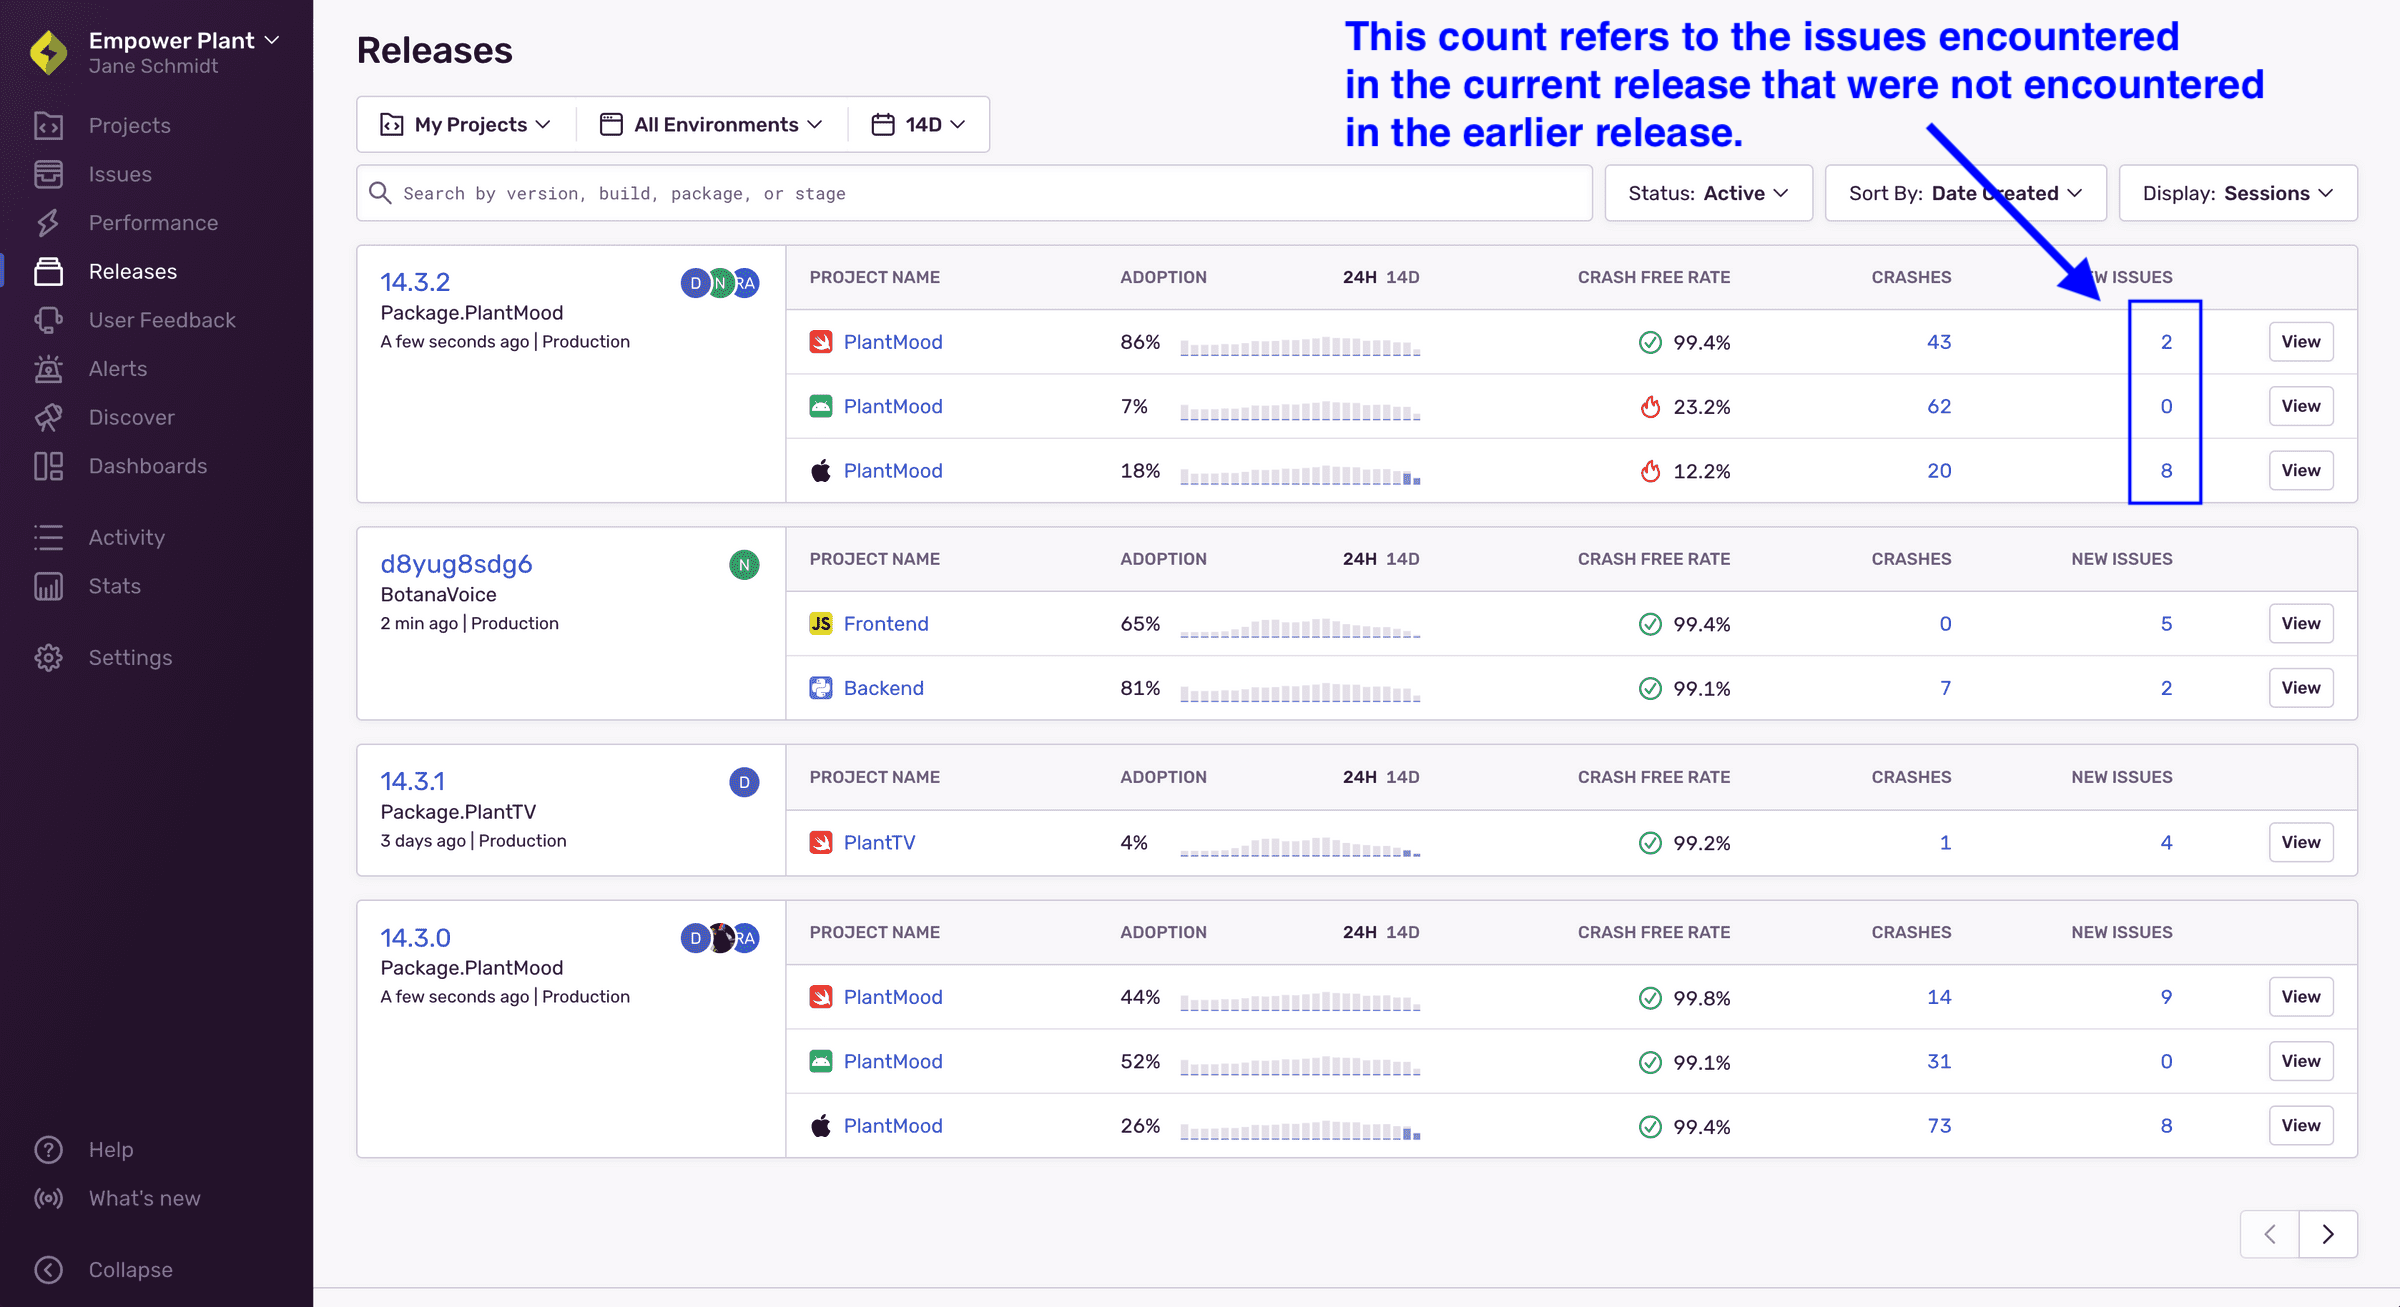
Once we set up the release as above, Sentry maintains a very helpful firstRelease tag for every event. This allows us to:
- Narrow down the release that introduced an event.
- Maintain a quality check via the number of new events introduced over a period.
We are hoping this will be helpful in keeping things sane on the Sentry issues front in the future.

It is also helpful to set up an alert that triggers when a release results in new issues that haven’t been encountered in the earlier releases.
Conclusion
Getting the Sentry setup right is an iterative process which has to be built incrementally. For us, it took us nearly 6 weeks to transform Sentry’s data deluge into a well-steered system that would keep our production issues in check.
And, as we went about gradually improving our Sentry setup, we also fixed the identified issues. We remained data-driven to ensure effectiveness of the exercise amidst the data deluge. This helped us reduce our error-rate by 80% in the same 6 weeks duration.

Want a fast frontend that scales?
I've built and improved B2C frontends serving 2M+ monthly users to:
- Optimize Core Web Vitals
- Solve scalability issues
- Implement SEO compliance
- Select the right framework, library and hosting platform
- Incrementally migrate or upgrade frontend frameworks
B2C clients Include:


Or email: punit@tezify.com

- Solve scalability issues
- Optimize Core Web Vitals
- Implement SEO compliance
- Select the right framework, library and hosting platform
- Incrementally migrate or upgrade frontend frameworks
 Hire Me